Customer Segmentation at Glovo - Part 2

Part 2: Segmentation system design
Note: This post is an adaptation of my original post in Glovo’s Medium blog Customer Segmentation at Glovo Part 2: Segmentation system design.
In part 1, we talked about the customer segmentation needs at Glovo and why we need to customize the customer’s UX. For example, we needed to target specific audiences for certain discounts. We also discussed the need to separate the segment’s calculations task from the segment’s restful API. In part 2, we will dive into the two components: explaining their respective responsibilities and the overall architecture.
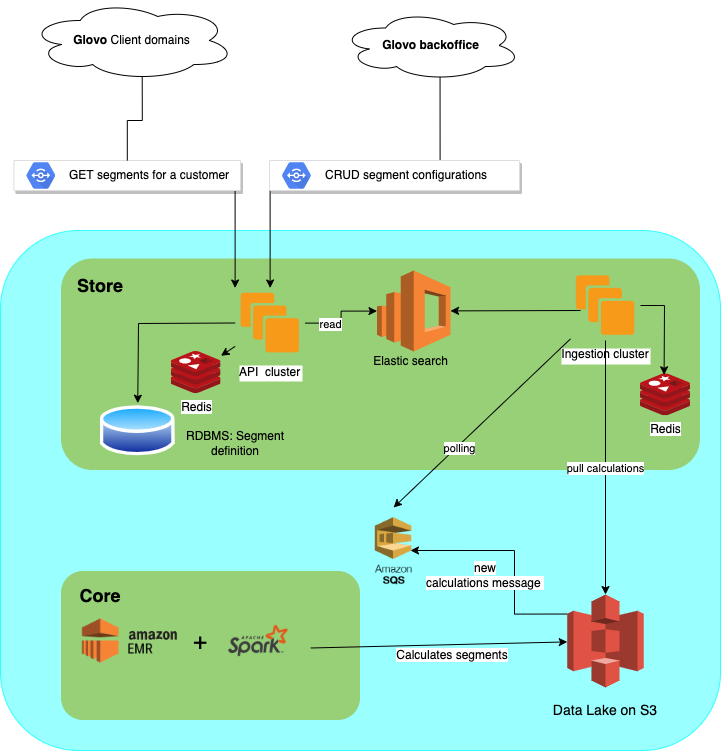
We named the two components “Core” and “Store”; the Core is responsible for performing Segment calculations in a scheduled fashion (every X minutes/hours), based on the segment definitions provided; the Store is in charge of segment configuration management and auditing, and also serving the calculated segments to the rest of the system. Also, between these components, we need integrations to exchange segment configurations and segment results, to finally expose those results to the external parties.
See the full architecture below:

Going into details for each component, integrations, and how the data flows:
Core
For data calculations, we decided to leverage Glovo’s existing Data Lake and Big Data tools. Here were our reasons:
- We knew we needed to query data from multiple domains, initially orders, users, and products but possibly many others in the future as we defined new segment types. The Data Lake, built on S3, solved this requirement out of the box. It is a centralized store already gathering data from most of the domains in the system. Although data in the Data Lake was not live data (it was refreshed every half an hour), we didn’t need live data for most of the segmentation cases.
- Performing the segment calculations would involve hundreds of millions of rows, and terabytes of data. So it was clear to us that the best way to perform these calculations was using Big Data processing tools. At Glovo we use AWS EMR and PySpark to run calculations on the Data Lake.
The full stack for the core included also Jenkins and Luigi. New segment calculations would be put in an S3 prefix for the given DateTime, and historical data could be eventually deleted by using object expiration policies.
Store
As this component is responsible for segment configurations management and also serving segment calculations, it includes several parts: the backend exposing a restful API, an RDBMS holding the segment configurations, an Elastic search cluster to store and serve the segments calculations to the backend, and Redis for caching customer-segments queries to achieve the low latency needed.
As explained earlier, in order to move the calculated segments from the Store to the Core, we designed an ingestion process.
Elasticsearch
We took multiple factors into consideration to select the proper data store for segment calculations search. First and foremost, was the volume of data initial estimations. We expected 1K segments to be created by the business and partners for the initial phase. Beyond that, we anticipated over 100K segments once more segment types were added. Each one of these segments could have millions of customers and on average be around 50 MB. The second critical factor was that a given customer could belong to a multitiude of segments but different stakeholders would only be interested in a subset of segments for a given customer. For example, one might only care about segments for a particular store, or specific categories (pharmacies, not restaurants), and so forth. This meant we needed a search engine that could scale horizontally and was capable of querying by multiple, unbounded fields. And potentially, in the future, use-cases using text search. We agreed the best choice was ElasticSearch.
We faced several interesting and challenging points during the ElasticSearch setup. We discovered performance improvements by using term queries from our Spring elastic client. We learned to select the proper data types for each indexed field (such as using keyword type for id fields). We also tweaked the elastic index refresh rate to reduce the latencies of the queries and partitioned large docs to remain below the maximum document size.
Store clusters: Api and Ingestion
Given the very different workloads of ingesting data from the Core and serving that data to outside domains, we opted for separate clusters for each task; splitting reads and writes. This would allow us to ingest in a decoupled and efficient way, scaling each cluster independently.
The ingestion flow would work as follows: When the task to process a new calculation is triggered, the PySpark cluster starts generating segments that are later ingested by the Store Ingestion cluster and stored in a new Elastic Search index. To achieve efficient ingestion we leveraged several techniques:
- We used “Elastic Search alias switch” to quickly swap between the old and the new index.
- We used Elastic’s bulk API, parallelization, and retries in case of errors to efficiently insert into Elastic Search.
- We used a Redis lock and tweaked the message visibility timeout to expire old messages so as to have an at-most-once semantic; distinct from the at-least-once of SQS.
Redis Cache in the API Cluster
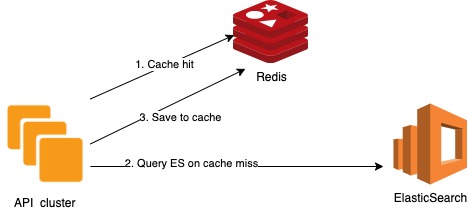
We had committed to an SLO of p99 < 50ms and to achieve it we leveraged the eventually-consistent nature of the segment calculations we were serving. We could cache heavily without worrying so much about the time to live (TTL) of the entries or the cache invalidation. With Redis as a simple cache-aside strategy, we cached the most frequently accessed customer segments. Not only did we drop the latency to less than 10ms but we also reduced the load on the Elastic cluster. Before adding Redis due to a load of requests [10K / sec at the peak] elastic was going up to the 250ms, at least for some of the requests.

Rollout Checklist
Before we rolled out the project, we had a large checklist to validate the readiness of the multiple components and clients. We prepared an exhaustive rollout plan to minimize the chances of failure and to be ready for possible rollbacks. We also ensured documentation is in a centralized place, including the design, observability links, and OpenAPI Specification of our Restful endpoints. The rollout would start in a single city, then expand to the whole country, and finally to other countries. The gradual increase in the traffic could unveil any errors or performance issues early. AB tests were used to validate the results.
Performance testing
To accommodate the load from the client domains, we had to define initial sizes for our API, Ingestion, ElasticSearch, and ElastiCache clusters. Since we didn’t have a proper load testing tool by that time, we used JMeter to perform a first load test on the service. Later we enabled shadow traffic from the real clients with all the proper observability around the key metrics. We adjusted the clusters node minimum and maximum node count, the node instance sizes, storage types, etc. until we reached the performance we required. Beyond that, autoscaling would adapt according to the load.
Resiliency
We couldn’t risk harming our existing clients’ SLOs and we had to define our Segmentation SLO respecting the upstream services. On the ingestion process side, resilience was needed when reading segment parts from S3 and persisting to ElasticSearch. Moreover, we didn’t want to halt the entire ingestion of terabytes of data when a single part, out of thousands, would fail so we set up error tolerance rates. On the Elastic side, we wanted to keep the previously ingested data from old indexes for a while. In this case, the new index wouldn’t be created for failures during segments calculations or ingestion. Therefore, we used indexes lifecycle policies. Finally, the client’s synchronous calls to our API cluster were protected with circuit breakers, timeouts, and retries.
Observability
To deliver the project proper observability was critical. This included logs, metrics, dashboards, monitors, and alerts. Initially, the alerts would point to a dedicated Slack channel and later promoted to Pagerduty to reach the on-call engineer. On-call run-books were updated as well.
Main observability resources:
- Datadog’s Application Performance Monitoring (APM) for our different clusters, including API, Ingestion, and ElasticSearch.
- General segmentation metrics dashboard, including endpoints, ingestions, segments calculations, SQS queues, and HTTP Client’s health
- Kibana to keep track of the index’s status, including their size, document count, and policies, and to have a handy way to execute queries against Elastic.
Rollout results and next steps
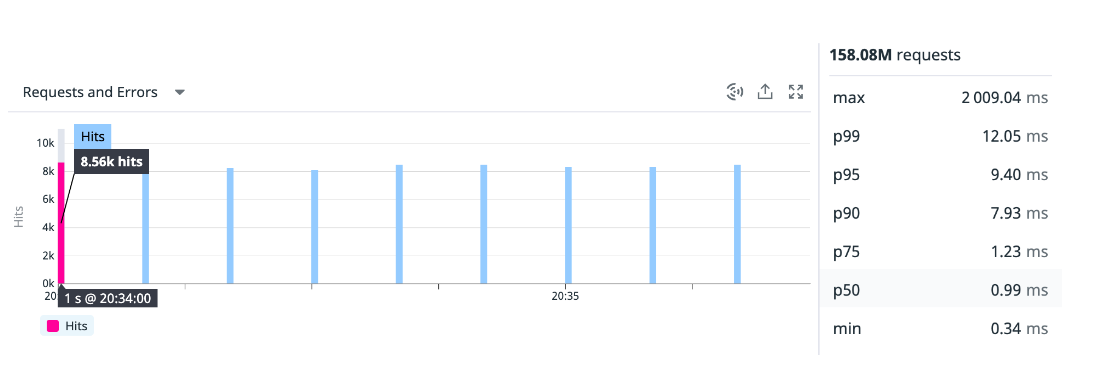
The production rollout was a success, no downtime nor rollbacks were needed. The application was already serving up to 10K requests per second, with a p99 of 12.05ms on average, and p75 avg 1.23ms.

Segmentation has been a success for the business, increasing the conversion rate for discounts for new customers. Analysts using our AB-testing tools and Data warehouse are still gathering insights about the impact, as they also explore how we can further leverage the segmentation capabilities to increase our customer base and personalize each customer’s experience across Glovo’s platform. As Segmentation starts gaining traction in the company and new interests arise, other teams are starting to explore how they can benefit from it, and we anticipate various improvements to how segmentation works in the future.

Comments